

EN
What is CAC (Customer Acquisition Cost)
How much does user acquisition cost in 2026?
Mobile app user acquisition costs by platforms, regions and channels
How much mobile user acquisition costs by genre
What top mobile game publishers spend on UA (real examples)
Get a monthly loot box of insights straight to your email!
Subscribe
game-advertisers
It costs money to make money, which is especially true when you’re acquiring or converting mobile users. The challenge is keeping those costs low since any return on investment is less impressive when overpaying for each customer. That’s why marketing strategies must account for the type of app they’re promoting as well as the channels that provide the best value.
In this article, we go over the cost of user acquisition in 2026 and analyze how much big app companies are spending to acquire their users. With the latest key performance indicator benchmarks, marketers will be in the best position to keep profits high and user acquisition costs low.
👀 Related reading: Mobile user acquisition: The modern developer's guide
Customer Acquisition Cost (also called CAC or cost of user acquisition) refers to the cost of acquiring new users for your app or players for your game. User acquisition expenses typically include all those costs associated with sales, marketing, and advertising.
For example, a few cost centres to consider when you calculate your CAC are:
To determine how much you spend on acquiring new users, you can use this formula:
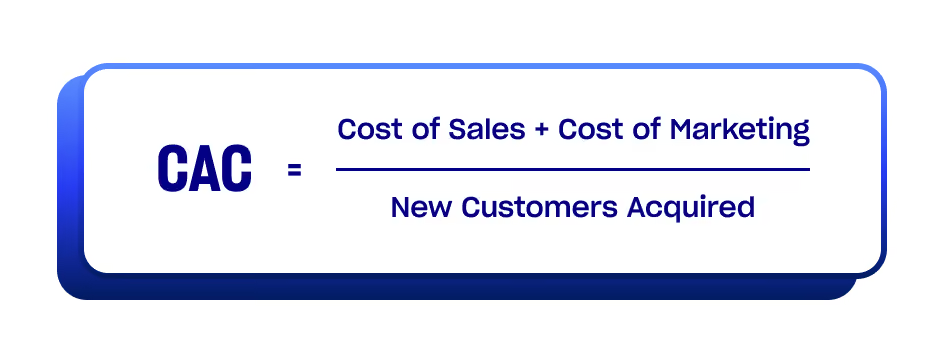
Let’s say that you spent $2000 and you acquired 500 users. Your CAC here would be $4.
In 2025, the gaming industry spent $25 billion on user acquisition (AppsFlyer, The State of Gaming for Marketers – 2026 Edition).
In general, it’s not possible to calculate an average CAC, since expenses vary from studio to studio. Factors that can affect costs range from where you advertise to which platform you’re on to what kind of app or game you’re promoting.
A metric that can give us an idea of an average user acquisition cost is the CPI (cost per install). CPIs are a major component of UA and refer to the price you pay for each new install. In 2026, these are the average mobile CPIs for apps and mobile games:
UA mainstays like Facebook and Google have become hit or miss as more users choose not to have their online activity tracked, limiting the information available to advertisers as a result. Fortunately, some helpful industry-wide data on the cost of mobile app advertising is still available thanks to the efforts of individual companies.
Now, let’s take a look at average CPIs for different platforms and mobile game categories.
Platform-level differences continue to play a significant role in mobile user acquisition costs:
Historically, iOS has had higher CPIs due to stronger monetization performance and higher average LTV. As a result, iOS continues to attract a higher share of UA budgets, particularly in North America and Europe. However, the CPI gap between iOS and Android has narrowed in recent years as Android monetization improves and competition intensifies across both platforms.
Geography is another strong factor in acquisition cost, with CPIs reflecting differences in purchasing power, advertiser competition, and platform penetration:
North America remains the most expensive region for mobile user acquisition by a wide margin. This is driven by intense advertiser competition and high LTV expectations, particularly in the US. According to AppsFlyer, in 2025, 50% of total UA budgets were allocated to the US, reinforcing its role as both the most lucrative and most competitive acquisition market globally. On the other hand, lower-cost regions such as APAC and Latin America continue to offer attractive opportunities for scale.
In 2026, Facebook Ads CPI is listed with a minimum of $2.00 USD and a max of $5.50 USD (Business of Apps).
While Facebook is not the only social media platform in 2026, it is undoubtedly the largest, boasting just under 3 billion monthly active users according to Meta Platforms.4 That makes it the only marketing channel that could reach 37% of the human race. However, this access does contribute to a noteworthy mobile user acquisition cost, especially for brands looking to fully convert Facebook users into customers instead of just driving installs.
From the Meta Ads platform, marketers can organize campaigns with performance-based objectives: Revealbot’s ad dashboard5 shows that Facebook conversions cost between $10.23 to $19.32 over the past twelve months. If your goal is to convince users to install your app or mobile game, the effort is far more cost-effective. Revealbot rated these costs between $0.87 and $4.73 in the past year. This range is slightly lower than in 2020 when Adspresso data (retrieved by Business of Apps6) put Facebook’s CPI from $1 to $6.10.
In 2026, Google Ads CPI is listed with a minimum of $1.50 USD and a max of $4.50 USD (Business of Apps).
Google is a fixture of the mobile marketing landscape, thanks in no small part to its powerful search engine and the Android operating system. According to StatCounter7, Android is used by 68% of mobile device users, and has remained the most popular mobile operating system in the world for more than a decade — ergo, Google’s own extensive advertising options are a great way to look for new users. Unfortunately, that means everyone is competing to reach Google’s audience, raising the overall user acquisition cost.
When examining Google Ads for mobile users, it’s important to distinguish between Display and Search ads, otherwise known as “push and pull” advertising. The Google Display Network deploys ad placements across the internet, anywhere from blogs to YouTube. Meanwhile, Search ads only appear when users are searching for related keywords. People actively searching a topic are more likely to engage with ads, significantly decreasing costs and increasing conversion rates (CVR). The below figures from WordStream8 provide a high-level overview of app user acquisition costs for Google Ads.
In 2026, Tiktok ads CPI is listed with a minimum of $1.75 USD and a max of $4.00 USD (Business of Apps).
Where most marketing platforms calculate their average cost per user acquisition using CPA or CPI campaign models, TikTok campaigns operate on cost-per-click (CPC) and cost-per-mille (CPM) models. Thankfully, it’s possible to understand how it fits into the landscape by comparing these costs with overall engagement rates, as this report from Business of Apps9 shows.
Apple Search Ads adopted a cost-per-tap (CPT) campaign model in 2022, but the platform recently became more versatile. Today, marketers have the option to set CPA goals that fall within a maximum CPT bid, making it easier to estimate the cost per user acquisition. Much like Google, these results vary based on Search and Tab-based campaigns, as noted by SplitMetrics’ Apple Search Ads Benchmark Dashboard10.
👀 Related reading: Clicks to coins: Your guide to in-app advertising for mobile game monetization
As its own category, mobile games have different benchmarks for acquisition cost and CPI. According to Business of Apps, the average mobile game CPI on iOS is $4.22 USD, with the average Android CPI at $2.97 USD.
A quick look at the genre breakdown of CPI is as follows:
Now let's take a deeper look at some of the core game genres and their acquisition costs.
Casual games have long been a mainstay of mobile publisher catalogs, but the breadth of this genre (which can encompass puzzles, simulations, lifestyle games, and beyond) and shifting market conditions mean it’s far from placid. A Liftoff report1 sheds light on user acquisition costs from February 2024 to February 2025, where it found the overall CPI for casual games began to hover just around a dollar after fluctuations earlier in the year:
Though it’s helpful to look at them in aggregate, mobile marketers know “casual” is really an umbrella term for a broad variety of games with unique mechanics that appeal to different types of players. Here’s how Liftoff broke out the CPI by three main casual categories:
Though bringing players on board for your puzzle game may not be cheap, they’re the most likely fans of any genre to stick around for the long haul. Data from our 2023 Mobile Gaming Loyalty Report establishes puzzle games as the undisputed kings of D30 retention, thanks to their ability to deliver intuitive gameplay features, a seemingly unending stream of levels, and rewarding sessions regardless of length.
Looking for more in-depth data to help attract and retain players? Our inaugural Loyalty Index delivers a first-of-its-kind measurement method to help developers, publishers, and advertisers better understand how loyalty works in mobile gaming. Download the report today.

Since their players are more likely to fall into the “here for a good time, not a long time” camp, hypercasual games tend to have lower user acquisition costs for mobile apps than their casual counterparts. A report from Tenjin2 notes that the genre’s median CPI typically is $0.15 higher on iOS than on Android, but in the third quarter of 2022 that difference shrank to just $0.10:
Social casino games have seen significant upheaval in recent years, with massive gains from the pandemic colliding against the growth of real-money online casinos. Figures from Liftoff fluctuating mobile gaming user acquisition costs and a massive gap between the two ecosystems:
How are real companies approaching user acquisition? Below we’ve gathered examples from Playtika, Take-Two Interactive, and Scopely to show you how central user acquisition is in these companies’ budgets.
In its financial report for 2024, Playtika did not have a standalone user acquisition voice, but its UA costs were included within the Sales and Marketing expenses.
The total of these expenses was around $1.64 billion, and the company also states that user acquisition is a large component of that category.
Take-Two Interactive is a video games company that publishes video games for different platforms. In 2022, it acquired Zynga, which focuses only on mobile games.
In its financial report, Take-Two doesn’t break UA spend separately, and the cost of mobile UA is included in the overall operating expenses. In 2024, these expenses amounted to $5.83 billion. However, looking at the latest financial report for Zynga that we could find, the one for 2021, we see that expenses for Sales and Marketing amount to $955 million.
There aren't any public financial statements for Scopely, but their CEO stated that the company spent around $1 billion on marketing for Monopoly GO! alone. And the investment seemed to be worth it: the game has become one of the fastest-growing mobile games ever, and in 2025, it reached over $6 billion in lifetime in-app purchase revenue.
As you see, big gaming companies spend billions every year on UA. Of course, if you’re a small studio or an indie developer, this isn’t something you can do. But it shows you the importance of allocating part of your budget to UA campaigns.
So now that you have the full picture, let’s try and answer the most important question: how much should you spend on user acquisition?
To give you a clear answer, we asked our Demand Partnership Manager, Milky Dapon.
“User acquisition for mobile gaming usually splits into two phases. The first is a test phase. At this stage, advertisers usually spend $500-$1,000 per day, per region and platform. The goal of this phase is to validate CPI, retention and early ROAS. Then, once the performance is proven, the campaign is ready to scale. In this phase, the budget is higher, ranging from $3,000-$5,000 per day to $10,000-$15,000 per day for bigger advertisers.” – Milky Dapon
Overall, there’s no “right” budget on its own. The right spend level depends on how efficiently a campaign turns ad spend into long-term value. In other words, successful UA focuses less on volume and more on profitability and stability over time.
We’ve seen that the cost of user acquisition varies based on platform, region and genre, and what works for one studio may not work for another. At the end of the day, what matters most is understanding how user acquisition fits into your broader growth strategy.
The examples from large gaming companies show how central UA is to mobile gaming success. But you don’t need billion-dollar budgets to apply the same principles. Sometimes, you just need the right partner.
Mistplay can help you grow your user base and tap into a network of new, loyal users with rewarded advertising. Reach out to our experts to discover the many advantages of advertising with Mistplay.
SOURCES: