

EN

App and mobile game conversion rates can tell you a lot about the industry, but alone, they don’t give you the complete picture.
By analyzing benchmarks across genres and markets, this guide breaks down three critical benchmarks for every mobile game marketer: conversion rates, IPM (installs per mille from ads), and IAP performance. This data will give you insight into what types of games are growing right now and whether there are recurrent patterns to watch out for.
An app conversion rate measures how many of your users completed a specific action. The action in question can vary depending on your goals – whether it’s an install, creating an account, making a purchase, or reaching a specific in-game level.
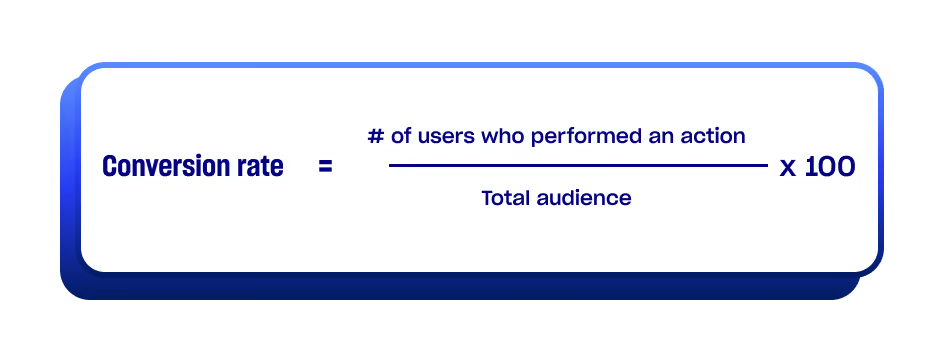
Let’s say that 1000 users viewed your page on the app store, but only 60 actually downloaded your game. Your app install conversion rate would be: (60/1000) x 100 = 6%
For this article, we will focus on benchmarking three core app conversion metrics:
Let’s dive right in.
The first thing to take note of is how differently users convert on iOS versus Android. By averaging the conversion rates across mobile game genres, it’s clear that the Google Play conversion rate is markedly higher.
Google Play having a better conversion rate than the Apple App Store may seem counterintuitive: it’s well-known that iOS users are usually of higher quality. However, conversion rate isn’t directly tied to monetization, but it measures how many people downloaded a game from the app stores. So, it’s more of an ASO metric.
Several factors drive the gap:
In particular, the average app install conversion rates in iOS for each category of mobile games are:
On the other hand, Google Play mobile game conversion rates are:
Looking at the mobile game genres with the lowest conversion rates, both charts show Board, Card and Word games as the bottom genres.
It isn’t difficult to understand why: there are many of these games available in the app stores, so each title faces stronger competition compared to other genres.
The data in this section was taken from the Business of Apps.
IPM rates measure how effectively your ads drive installs—specifically, how many downloads you get from 1,000 ad impressions. According to Adjust's 2025 gaming apps report, the average global IPM was 8.62.
Here's how average IPM breaks down by mobile gaming category:
The chart shows slightly different data from the conversion rates for mobile games, but Racing and Music games are still in the top 3 positions.
Of course, regions also have an impact on IPM rates. Here are the average IPM rates, according to Adjust:
Overall, we notice minimal differences across regions.
Looking at the top countries for IPM rates, these are the five that stand out:
The data in the section was taken from Adjust.
Lastly, let’s take a look at the average rate for in-app purchases.
While downloads can be a volatile metric – after all, your players can uninstall your game shortly after – IAP rates give a better understanding of performance and revenue potential. According to Sensor Tower, the total IAP revenue in 2025 was $81.7 billion, a +1.3% increase from 2024. So, the trend is overall positive across the whole industry.
This is how the different categories performed in 2025:
The mobile game genres that experienced the highest growth in terms of IAP were Strategy, Puzzle and Shooter games. This growth is mostly led by top-performing games, such as Last War Survival, Royal Match or Delta Force. On the other hand, RPG, Action and Casino earned way less than in 2024.
The data in the section was taken from Sensor Tower.
Now that we’ve laid out these common mobile game metric benchmarks, what do these numbers actually mean for your strategy?
Platform performance is more nuanced than it appears. Android has higher conversion rates for mobile games, but iOS users bring higher retention and spending. From a UA perspective, this means that you may need to implement two different strategies based on the platform and your goals.
Conversion rates and IAP don’t always match.
In general, midcore titles are the ones with the best IAP performance, suggesting that it’s become more important to acquire a loyal audience rather than a huge one.
While countries like the United States, Japan or Korea are still the main goals of UA managers, you shouldn’t overlook emerging markets like India, Brazil or Mexico.
With their high IPM rates, these countries are more receptive to game discovery through ads. Combining this with lower customer acquisition costs, it’s the perfect opportunity to run tests with different ad creatives.
Overall, the shift is clear: relying on downloads alone isn’t enough. The real revenue lies in finding the right users and retaining them. As acquisition channels change and competition increases, this often requires rethinking how to find new, high-quality players.
At Mistplay, we help hundreds of studios and UA teams find the right audience through rewarded advertising. If you’re exploring ways to improve user acquisition without sacrificing player quality, we’re always happy to share insights or walk through real use cases.